USER’S GUIDE for the
CPL590/CPL592/EN591 – Capacitive Sensor Systems
TABLE OF CONTENTS
- APPROVAL AND SAFETY CONSIDERATIONS
- HELPFUL TECHNICAL SUPPORT DOCUMENTS ONLINE
- Probe Tip Contact Caution
- EN591 – CPL591/592 SUB-NANOMETER CAPACITIVE DISPLACEMENT SENSOR
- BASIC OPERATION
- INTERPRETING THE OUTPUT
- FRONT PANEL CONTROLS, INDICATORS AND CONNECTORS
- Zero Adjust
- Range Button (CPL592 Only)
- Calibrated Range Indicator
- Analog Output – Single Ended
- Probe Connector
- OVERVIEW OF REAR PANEL CONTROLS AND CONNECTORS
- Remote Power Supply & Differential Output
- Analog Output Differential
- USB
- LVDS SPI
- Bandwidth Settings
- Ground
- EN591 – CPL591/592 SPECIFICATIONS1
- EN591 Enclosure Drawings
- POWER SPECIFICATIONS
- EXTERNAL POWER SUPPLY
- APPENDIX A
- Demo Software Installation
- Demo Software Basic
- Main Data Display Screens
- APPENDIX B
- SPI – General
- Electric Digital IO Characteristic
- SPI Connector Pinout6
- SPI Interface Protocol
- Timing Diagrams
- Write Command
- Read Command
- Display Port Cable Reference Wiring
APPROVAL AND SAFETY CONSIDERATIONS
The EN591 is compliant with the following CE standards:
- Safety: IEC 61010-1:2010
- EMC: IEC 61326-1:2013, IEC 61326-2-3:2013, IEC 6100-3-2:2014, IEC 6100-3-3:2013 & EN 55011:2009 + A1:2010
To maintain compliance with these standards, the following operating conditions must be maintained:
- All I/O connecting cables must be shielded and less than three meters in length
- AC power cables must be rated at a minimum of 250 V and 5 A
- AC power must be connected to a grounded mains outlet rated less than 20A
- Use the included CE approved power supply with 1 slot enclosures. If an alternative power supply is used, it must have equivalent CE certification and provide safety isolation from the mains according to IEC 61010.
- Sensors must not be attached to parts operating at hazardous voltages in excess of 33VRMS or 70VDC
Use of the equipment in any other manner may impair its safety and EMI protections.
Probe Tip Contact Caution
The sensing tips of capacitive probes produce voltages as high as 70 Vrms. These are high frequency voltages with very low power, so they pose no danger. Normally when the probe tip is touched, the probe stops functioning and voltage is reduced to near zero. But under certain circumstances, the voltage may cause a slight tingle or burning sensation. For maximum performance probe tips should remain free of oils or other contaminants.
For these reasons, it is recommended the probe tips not be touched.
HELPFUL TECHNICAL SUPPORT DOCUMENTS ONLINE
Lion Precision’s website has a large selection of technical documents (TechNotes and Application Notes) in the Technical Library. These documents provide detailed descriptions of the operation and use of Lion Precision high-performance sensors.
The Technical Library can be accessed at: https://www.lionprecision.com/technical-library/
Some of the titles include:
- Understanding Sensor Resolution Specifications and Effects on Performance
- Capacitive Sensor Theory of Operation
- Error Sources: Probe/Target Angle
- Capacitive Sensors in Vacuum
- Capacitive Sensor Phasing and Ungrounded Targets
- Capacitive Probe Cabling Considerations
- Elite Series Phase/Amplitude Frequency Response
- Z-Height Measurement with Capacitive and Eddy-Current Sensors
- Thickness Measurement with Capacitive Sensors
- Glue Sensing with Capacitive Sensors
EN591 – CPL591/592 SUB-NANOMETER CAPACITIVE DISPLACEMENT SENSOR
The CPL591/592 capacitive sensor is a precision, noncontact measurement device with digital features added. The output can be voltage or digital with changes in direct linear proportion to displacement between the probe and the target. The sensor is normally used to measure conductive targets, but it can also be used with nonconductive targets under the correct conditions.
For more information about measuring nonconductors, visit the Technical Library at https://www.lionprecision.com/ or call for assistance.
BASIC OPERATION
|
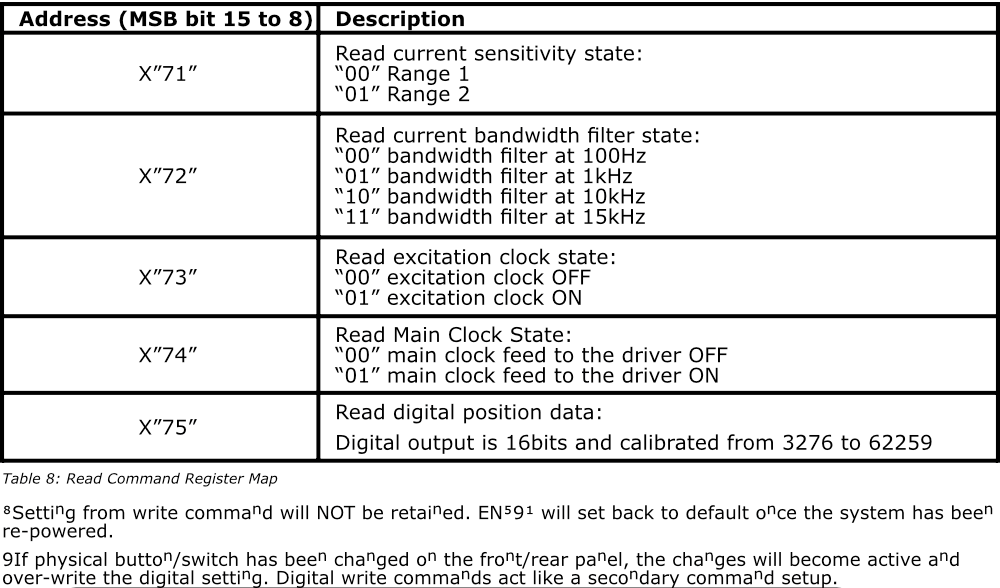
The analog output voltage can be accessed from two locations. Single-ended output via the front panel BNC connector, or differential output via the rear panel DB9 connector. As the probe approaches the target, the output voltage will become more negative/smaller and the same applies to digital output. The digital data is accessed via the USB, or through LVDS SPI via the display port. Digital data is presented by a 16-bit digital count from 0 to 65535 full scale where the calibrated range is from 3276 to 62259. Appendix A & Appendix B will provide more detailed information on the Demo Software and digital protocol command. NOTE: “Near” and “Far” red light indicate that the probe is out of its calibrated range and the output is not guaranteed to be accurate even though the voltage or counts may continue to change. Probes are calibrated to specific modules. Be sure the serial number on the probe matches the number on the calibration documents. The CPL592 provides two calibration ranges for a single probe. Use the range button at the front panel or digital protocol to select the desired sensitivity. Calibration detail is provided on the calibration documents included. Noncontact sensors normally measure changes from a reference position. |
 |
INTERPRETING THE OUTPUT
The amount of change of the output voltage or digital counts for a given change in the probe/target gap is called Sensitivity. The sensitivity of the sensor is listed on the calibration documents.
Change in gap calculation in Voltage:
Gap Change = Voltage Change / Sensitivity
For example: With a sensitivity of 1 V/2 µm and a voltage change of 3 V, the gap change would be 6 µm (3/0.5).
Change in gap calculation in Counts:
Gap Change = Count Change / Sensitivity
For example: With a sensitivity of 236 Counts/µm and a count change of 1416, the gap change would be 6 µm (1416/236).
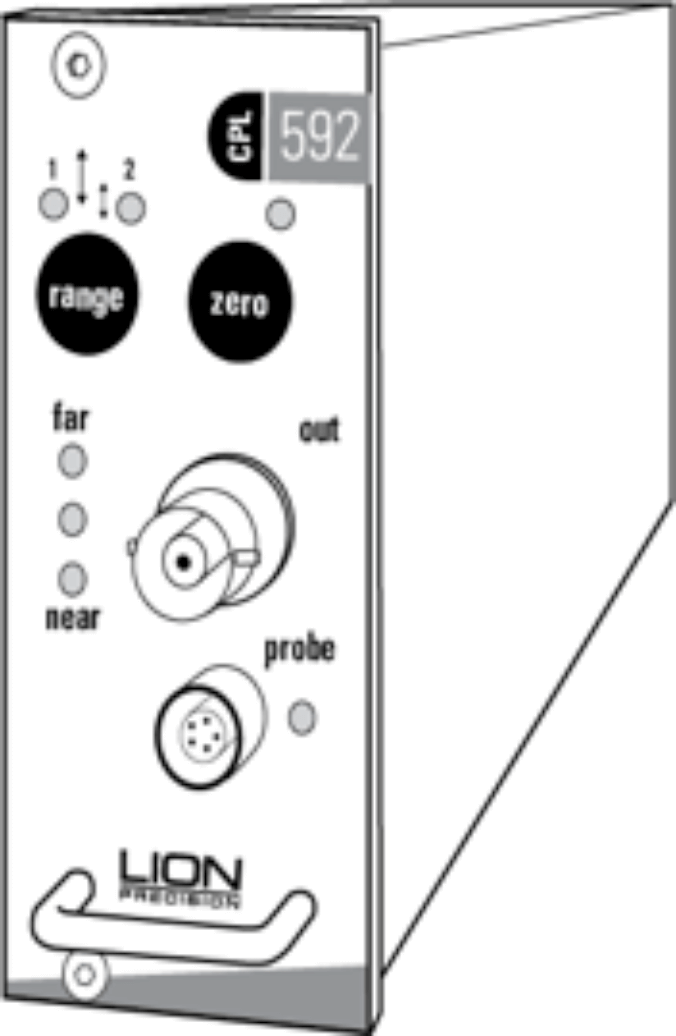
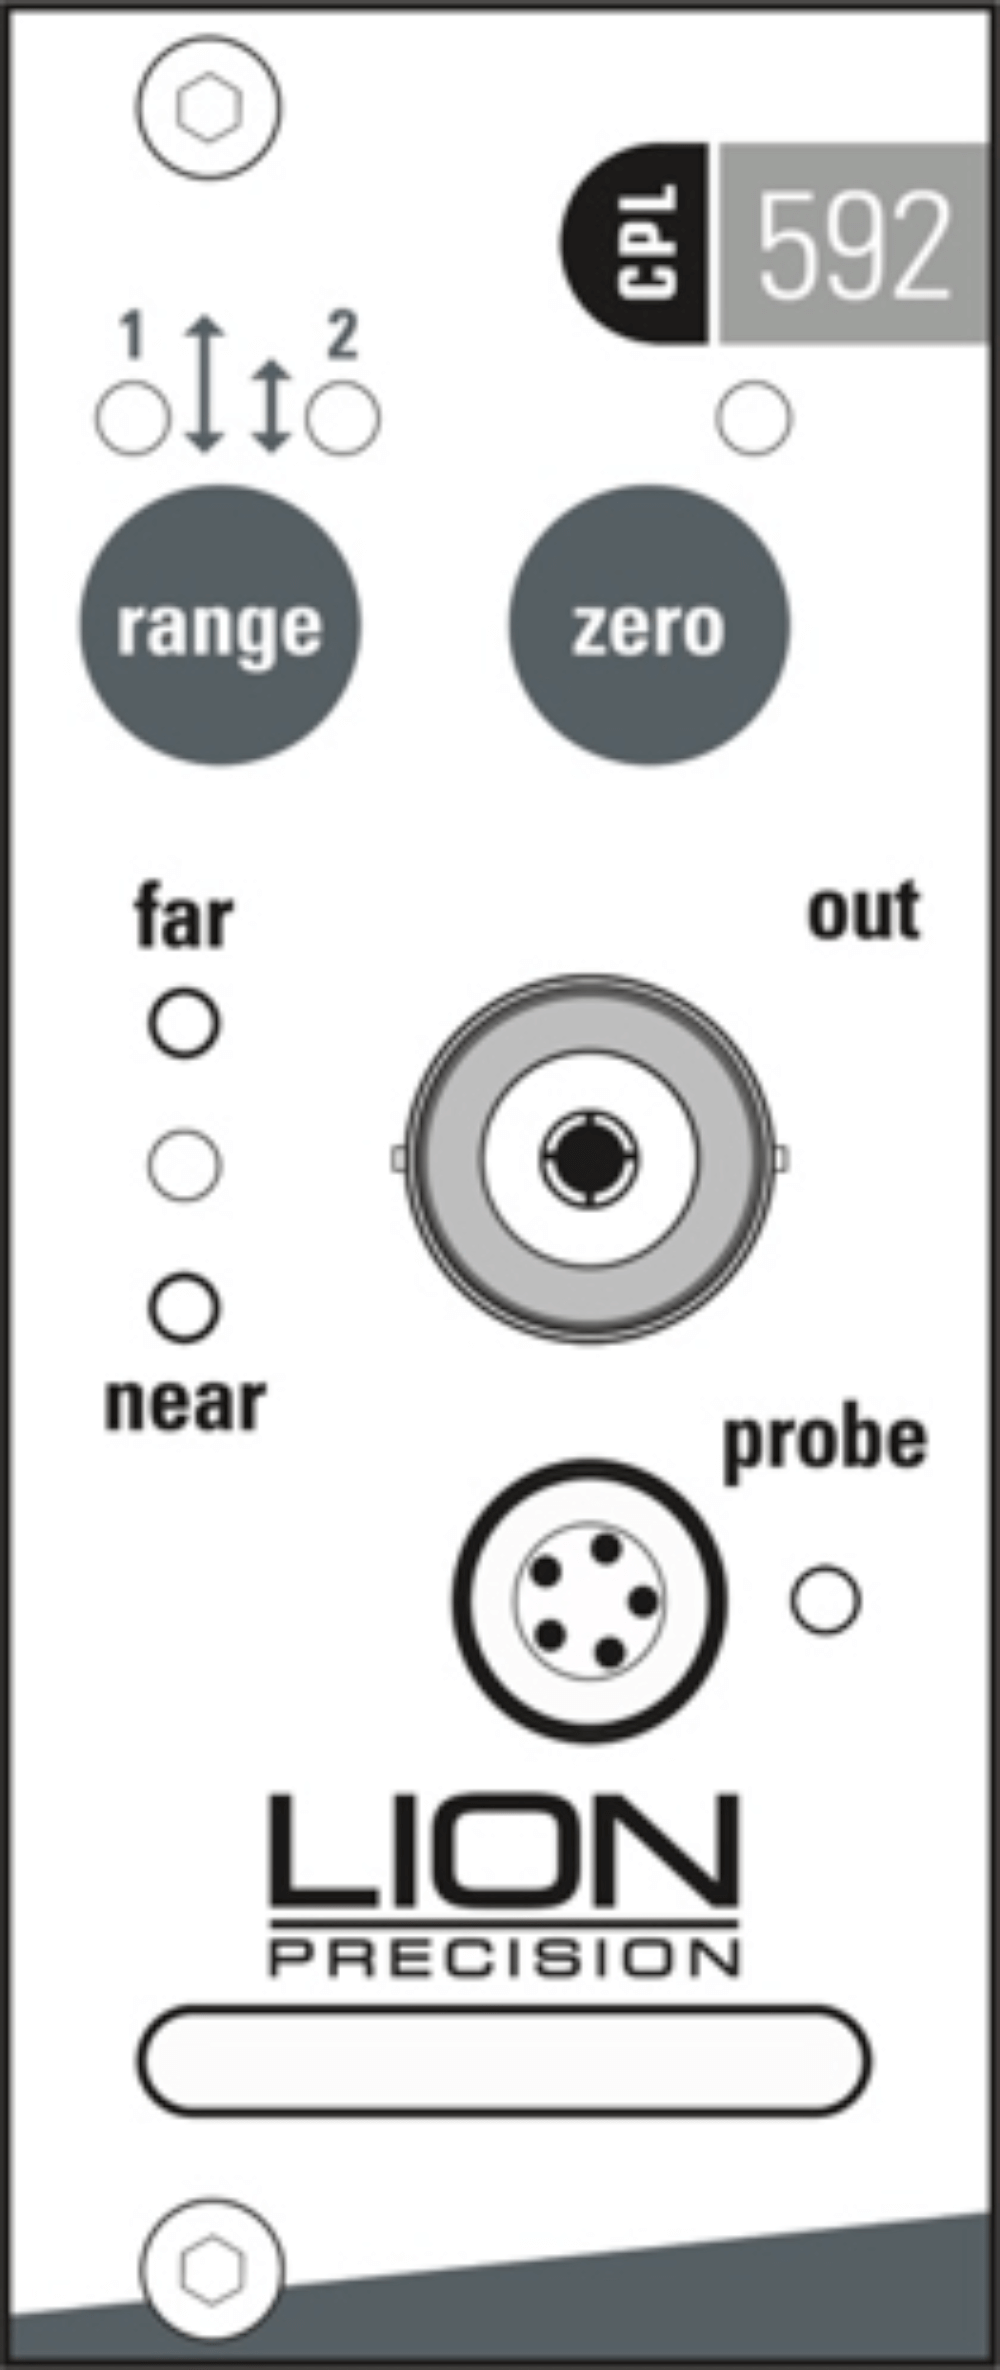
FRONT PANEL CONTROLS, INDICATORS AND CONNECTORS
|
Zero Adjust Adjusts the analog output voltage after the probe is initially positioned. Pushing the zero button while close to range center causes the analog output voltage at present position to adjust to zero volts. Pushing the zero button again will disable the zero adjustment. Range Button (CPL592 Only) The CPL592 provides two calibration ranges for a single probe. Refer to the calibration documents for specific calibration information. Pushing the range button will alternate between ranges. NOTE: Switching ranges will usually require repositioning the probe. Calibrated Range Indicator Green LEDs indicate that the probe is in its calibrated range and the output is an accurate representation of the target position. Red LEDs indicate that the probe is out of range and the output is not valid. |
 |
Analog Output – Single Ended
Provides connection to the analog output voltage, which is proportional to the distance between the probe and the surface of the material being measured. A typical output voltage range is ±10 VDC. The specific ranges are listed on the accompanying calibration documents.
Probe Connector
Connect the probe by aligning the red dots on the connectors and inserting the probe connector.
CAUTION: To disconnect the probe, pull on the knurled barrel of the probe connector to release it. DO NOT PULL ON THE CABLE.
OVERVIEW OF REAR PANEL CONTROLS AND CONNECTORS
Remote Power Supply & Differential Output
The EN591 is powered by +15 VDC, -15 VDC & +5 VDC via DB9 connector. It also provides differential analog voltage output.

Analog Output Differential
The non-inverted and inverted outputs are used together as a differential output. Differential output helps eliminate electrical noise induced into the connecting wires by noise source such as computers, power transformers, etc.
The non-inverted output voltage become more negative (relative to ground) as the probe nears the target. The inverted output voltage becomes more positive (relative to ground) as the probe nears the target. The non-inverted and inverted outputs are each ±5 VDC relative to ground; the differential output is therefore ±10 VDC.
The analog output connection pins are positioned to allow for twisted pair cable for maximum differential noise reduction.
CAUTION: DO NOT connect the outputs to ground or the unit will be damaged.
USB
The EN591 provides a high/full speed USB 2.0 interface to gather digital data from the device to a PC. USB API documents, Demo Program, and examples can be downloaded from the product webpage. Appendix A provides a quick overview of the Quick Start Demo Program running on USB.
Further information for using the USB API:
CPL590 API Document (Click here to view PDF)
Further information for Quick Start Demo Program:
CPL590 Demo Software Manual (Click here to view PDF)
LVDS SPI
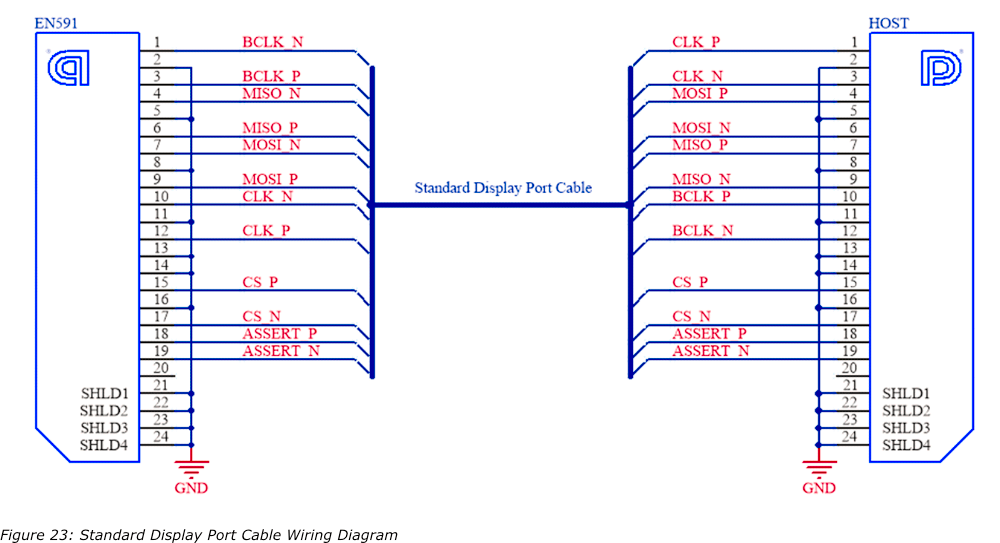
LVDS SPI is accessible through the display port. For closed loop applications or other real time applications, this low-level communication protocol can be connected to a microcontroller, microprocessor, FPGA, etc. It supports high speed sampling rate up to 10MHz (100 ns) and basic system controls such as sensitivity change, bandwidth change, and enable/disable excitation clock to the EN591. Appendix B provides electrical specifications, timing diagram, SPI commands, and a connection diagram for reference.
NOTE: Display port cables are not straight through.
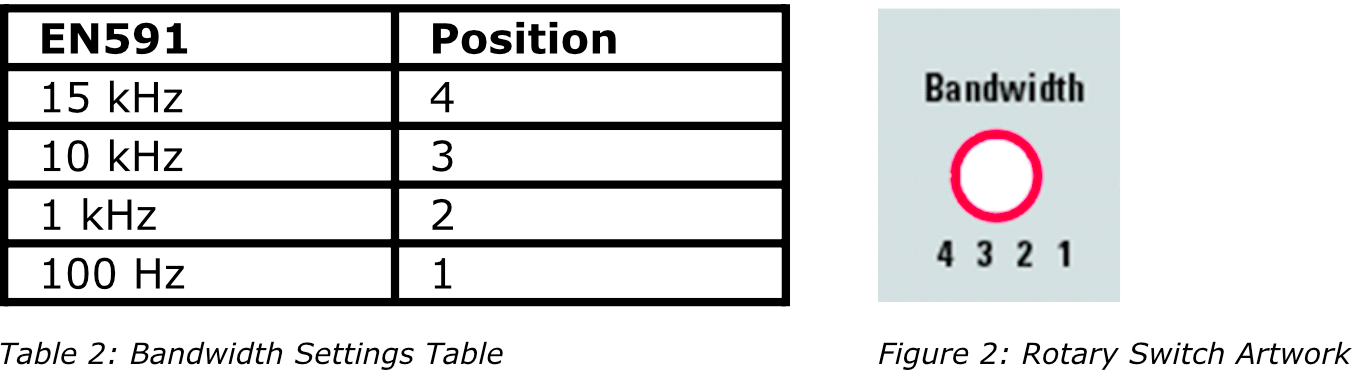
Bandwidth Settings
The EN591 provides a four-position rotary switch for setting signal bandwidth. The following switch image and table below show the bandwidths available and their associated physical switch settings.
Ground
There is a ground screw attached to the rear enclosure for grounding the target. In most cases, separate grounding of the target is not necessary. If the target is not grounded through another path, and the output exhibits excessive electrical noise, grounding the target may reduce the output noise. When low-noise operation is critical, separate grounding is recommended even if the target is well grounded through another path.
EN591 – CPL591/592 SPECIFICATIONS1
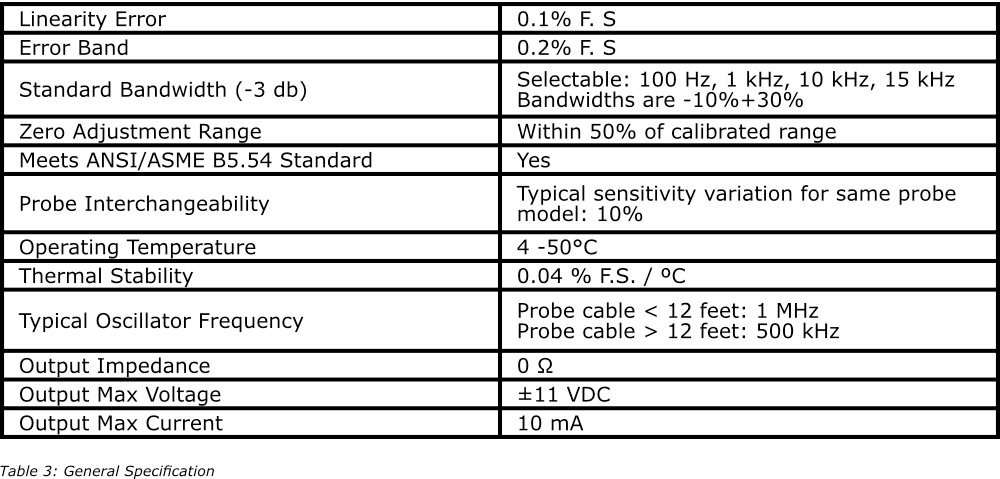
1These specifications are typical for standard components and calibrations. Customizations can affect performance. Check the calibration sheet shipped with the product for specific details on your system.
In high EMI environments (10 V/m), output noise may rise to 0.2 VRMS (1% resolution) and DC output may shift.
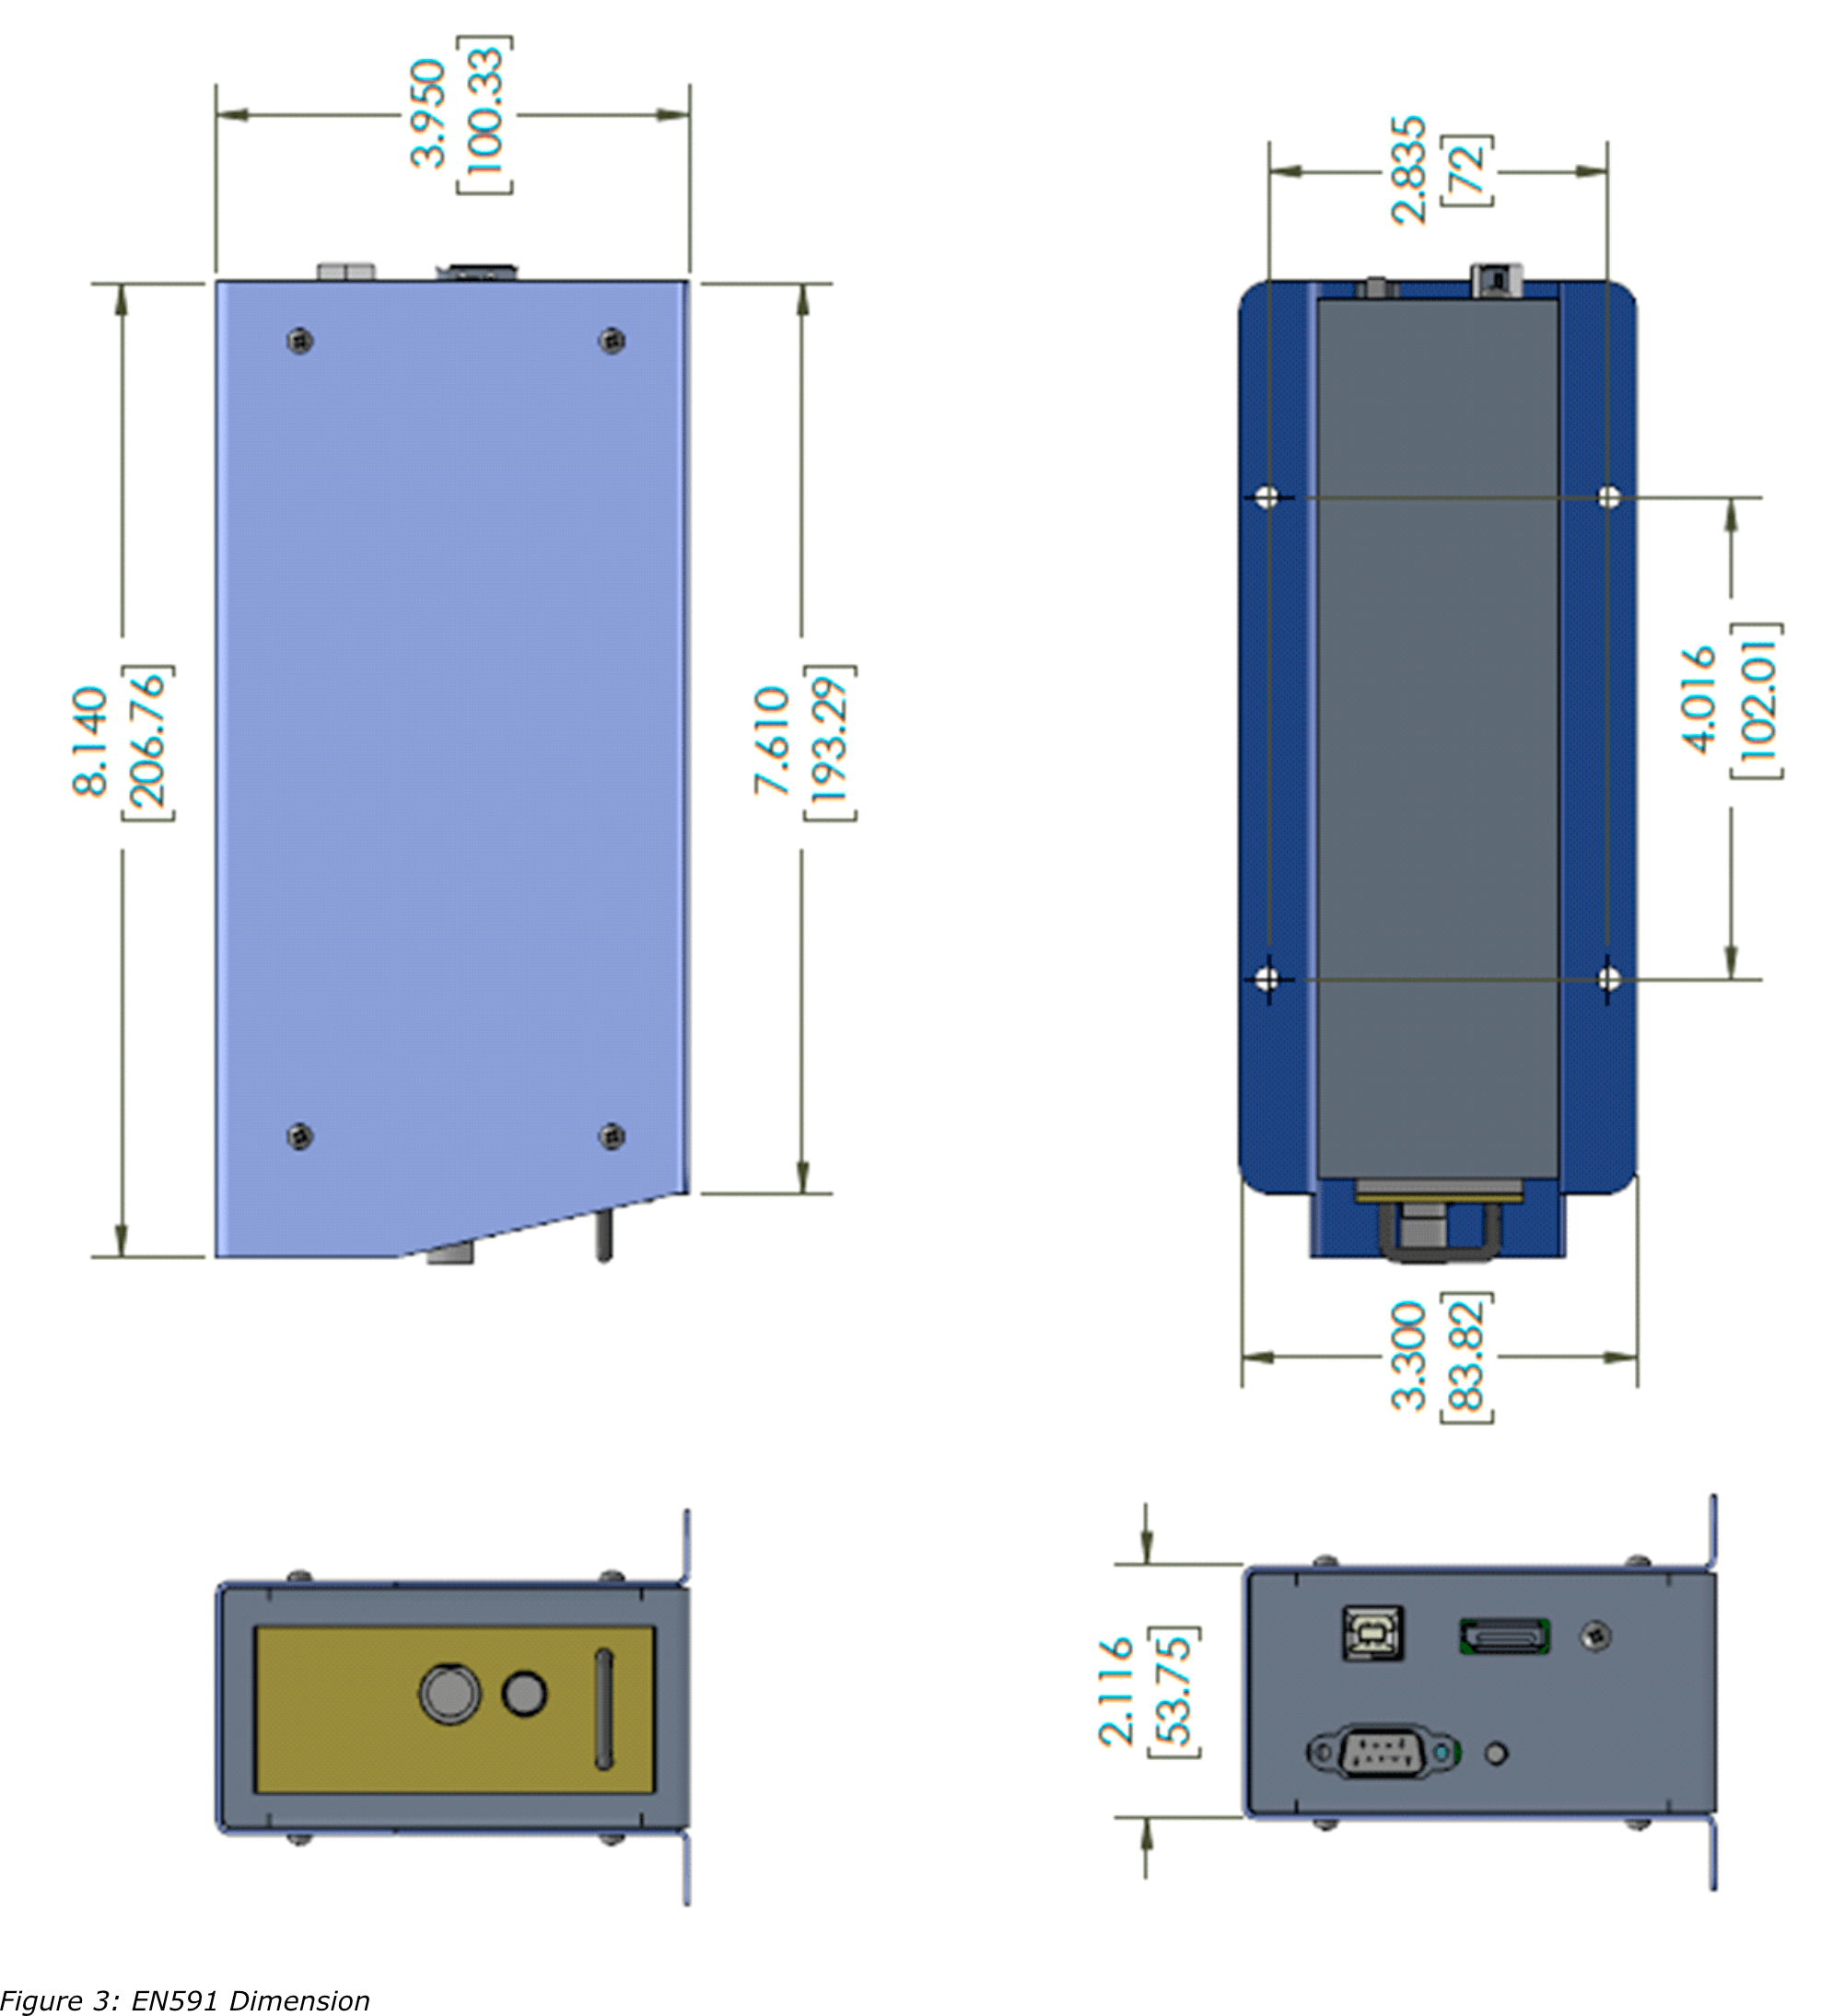
EN591 Enclosure Drawings
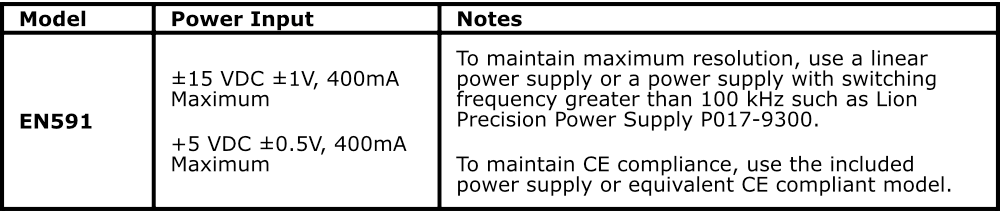
POWER SPECIFICATIONS
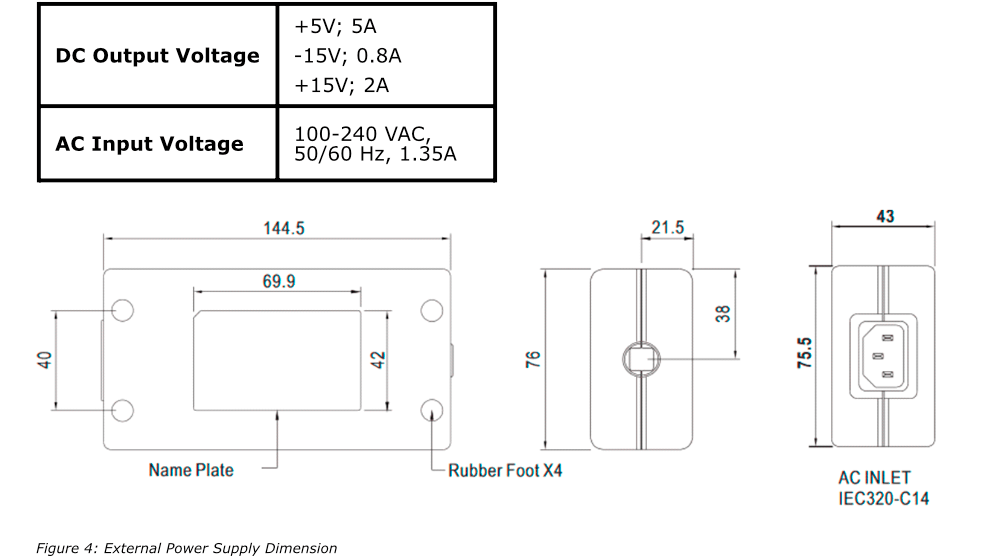
EXTERNAL POWER SUPPLY
The EN591 systems include an external power supply. The supply has a connector which allows direct connection to the enclosure.
This supply features a high-frequency (100kHz) switching supply. The high switching frequency allows the sensing modules to operate at maximum resolution.
APPENDIX A
Demo Software Installation
Minimum Requirements
- Window 7 & or higher (64 bit)
- 4 GB memory
- 2 GB free disk space
- USB port (2.0 or higher)
Installation Procedure
The software can be downloaded on the product webpage:
Lion Demo Program (Click here to Download)
To use the CPL590 Demo Viewer:
1. Download and run CPL590ViewerInstall.exe
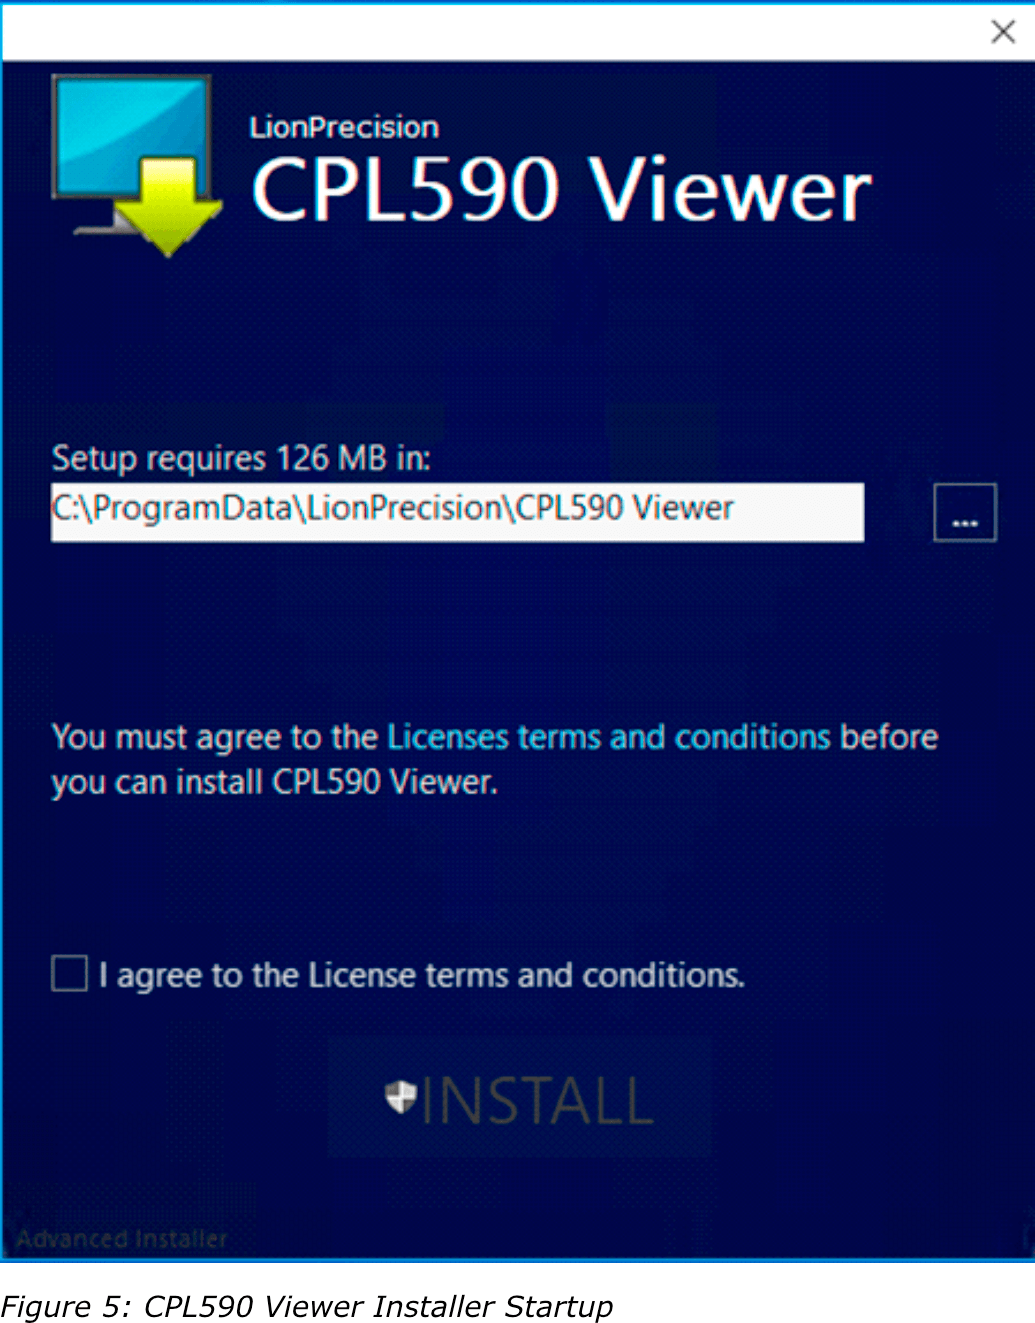
2. Read and agree to the T&C then click Install.
3. Follow the directions of the installation programs.
4. When the installation is complete, restart the computer.
5. After restarting, run the program on the desktop or by selecting Start > All Programs > CPL590 Demo Viewer > CPL590 Demo Viewer.exe
The CPL590 Demo Viewer program is installed in the \Program Files (x86)\LionPrecision\CPL590 Viewer\ directory on your hard disk. If you install the CPL590 Demo Viewer software a second time using the same subdirectory, the previous installation will automatically be uninstalled first.
Demo Software Basic
Scan & Connect Device
When the CPL590 Demo Viewer is launched (Start > CPL590 Demo Viewer) it will display a Splash Screen and query the operator to begin to scan for EN591 devices on the USB Bus:

If the operator selects the ‘Exit’ button, the program will close.
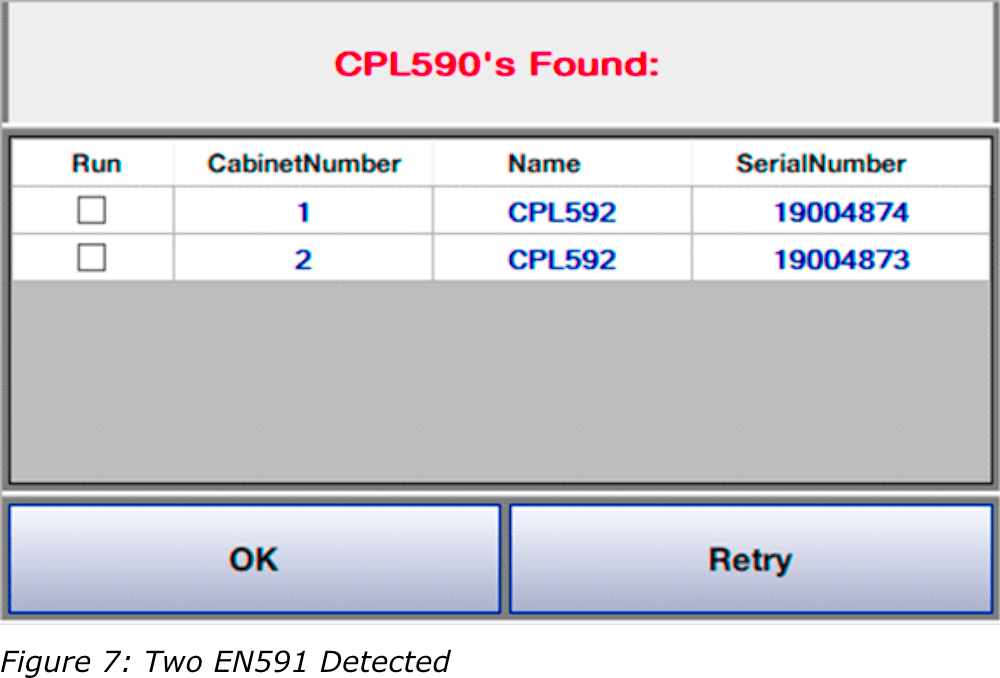
If the operator selects the ‘Scan’ button, the program will find all EN591 devices on the USB bus and display the device (cabinet) assignment number, the name, and serial numbers of each device/driver found. If it does not find EN591 device, the operator will be given the option to ‘Retry’ the connection.
If the Device/Driver is to be run, the operator must enable the ‘Run’ flag by checking the box:
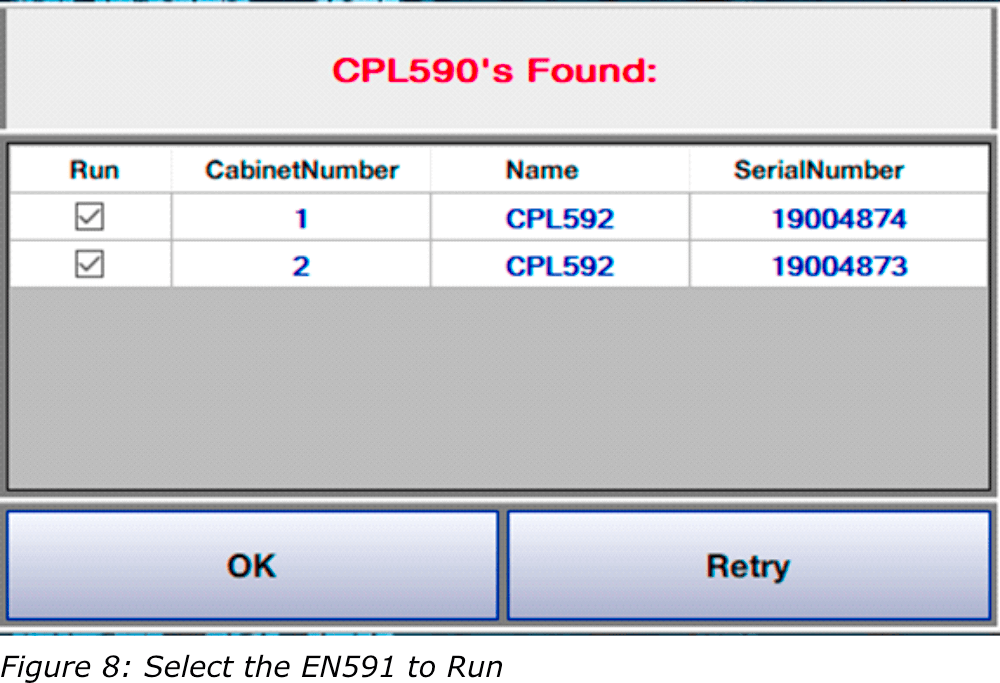
If the operator selects the ‘OK’ flag, the Home Screen will be displayed:
The program will automatically open a connection to the EN591 device after the Scan Dialog is closed.
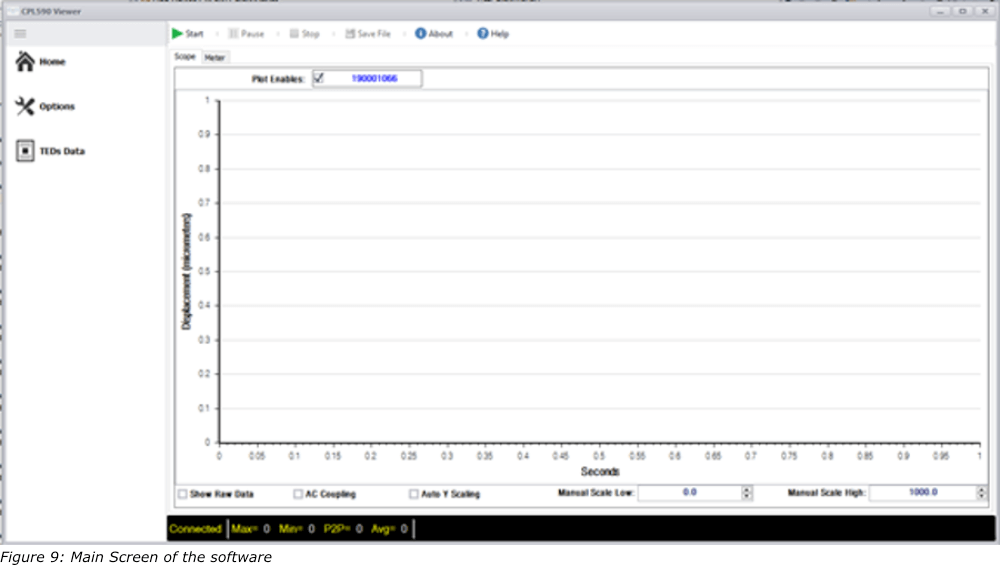
The Home screen will show the Oscilloscope display and the Serial number(s) of the Device/Driver(s) that were enabled to be ‘Run’ in the Scan screen.
The top menu shows the possible commands (Start, Pause, Stop, Save File, About, Help).
The bottom toolbar indicates the state of communicating with the Devices (Not Connected, Connected, Data Running, Data Paused, Data Stopped). The bottom toolbar also shows the statistics (Min value, Max value, Peak-to-Peak value, and Average value) of the data buffer received from the first Device.
The ‘Options’, ‘TEDs Data’, and ‘Zero/Gain Adjust’ menu items, on the left toolbar, will be disabled until the Device(s) has been successfully connected.
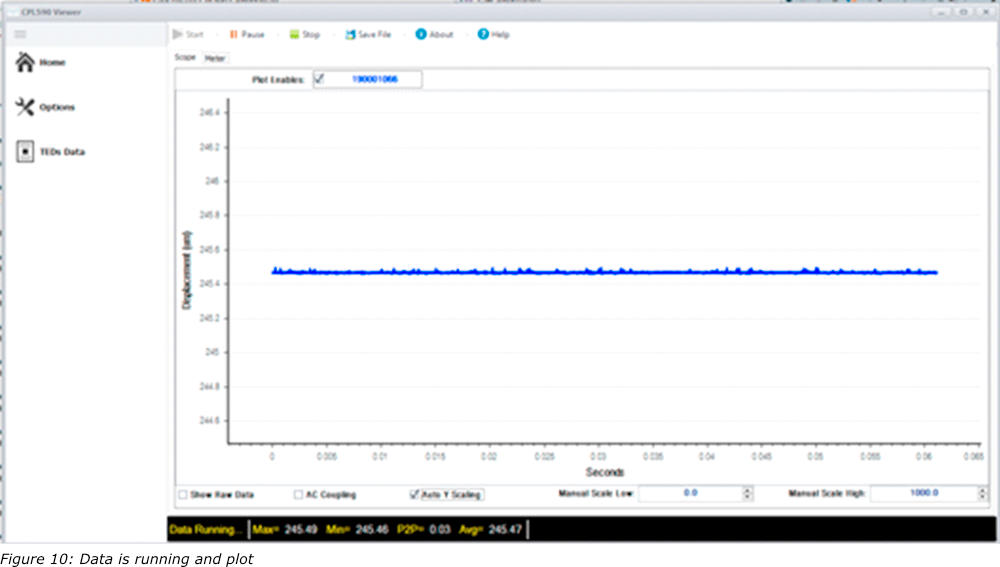
Start Data
The data transfer (receiving), from all Devices selected, will not happen until the operator selects the ‘Start’ button. The data will be received and displayed on the Scope View Screen (if the Plot Enable is checked). Once data transfer begins, the ‘Pause’, ‘Stop’ and ‘Save File’ button will be enabled.
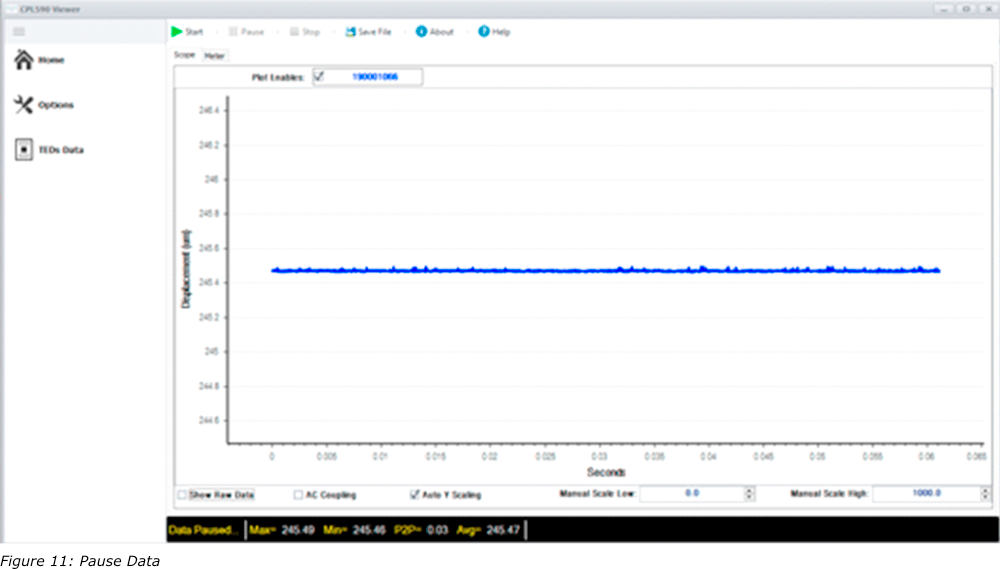
Pause Data
When the operator selects the ‘Pause’ button, the data shown on the Oscilloscope display will stop updating but the data will continue to be received from the Device.
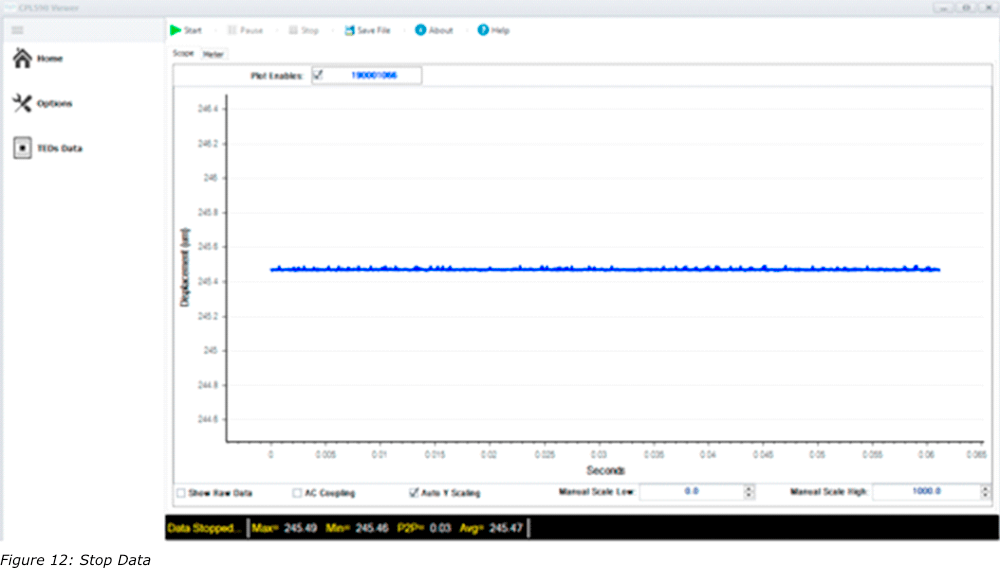
Stop Data
When the operator selects the ‘Stop’ button, the data transfer operation will be halted, and the data shown on the Oscilloscope display will stop updating.
Save File
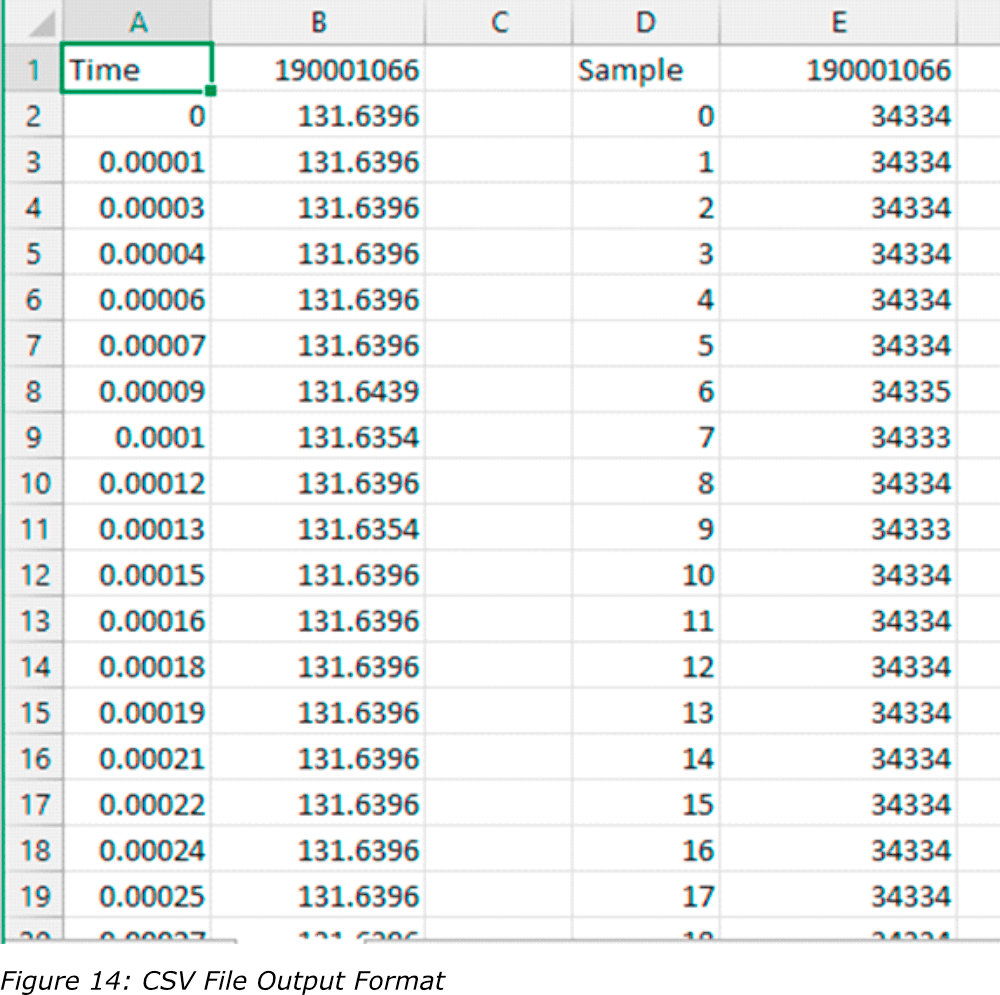
When the operator selects the ‘Save File’ button, the program will stop the data transfer operation and then display an Open file Dialog for the operator to choose the file name and directory to save a block of data to a file. The format of the file data is CSV (fields separated by a comma).
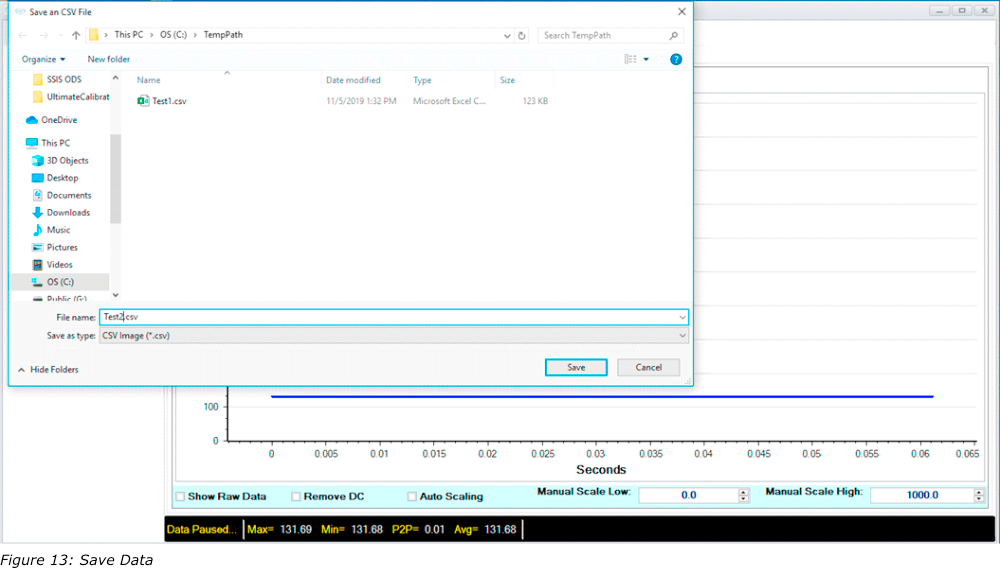
The data saved will be the data points from the Oscilloscope display. There will be a column for the Time stamp (in seconds), the Displacement (in micrometers), the Sample index, and the Raw Data count value. The header for the Displacement and Raw data is the serial number of the Device.
Options
When the operator selects the ‘Options’ menu item, the program will halt the data transfer and display the Options’ dialog:
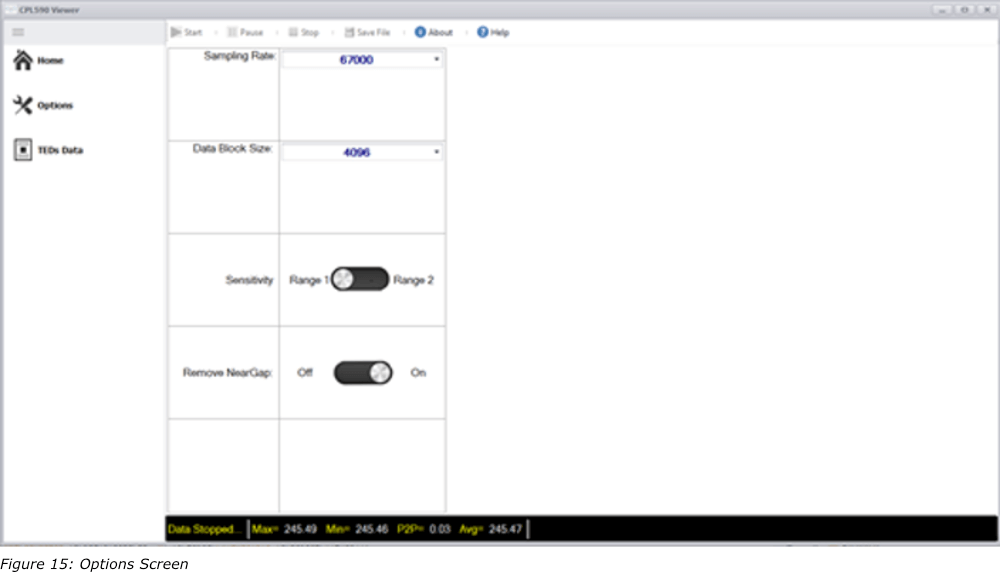
These options will not be activated until the operator selects the ‘Home’ menu item. Once this happens, the data transfer will resume with the new options.
Sampling Rate
Choose from a drop-down list of possible rates at which the EN591 Driver will sample the data from the probe each second. The possible choices are 500, 1000, 10000, 15000, and 67000.
Data Block Size
Choose from a drop-down list of possible data transfer block sizes (in 16-bit words). The possible choices are 4096, 8192, 16384, 32768, and 65536.
Sensitivity
This allows the operator to select which Sensitivity (Probe Range) that the Driver will use when taking measurements. The two ranges are programmed into the Driver at Calibration stage.
Remove Near Gap
This setting will determine if the program will subtract the Near Gap value from each calculated displacement value from the data buffer.
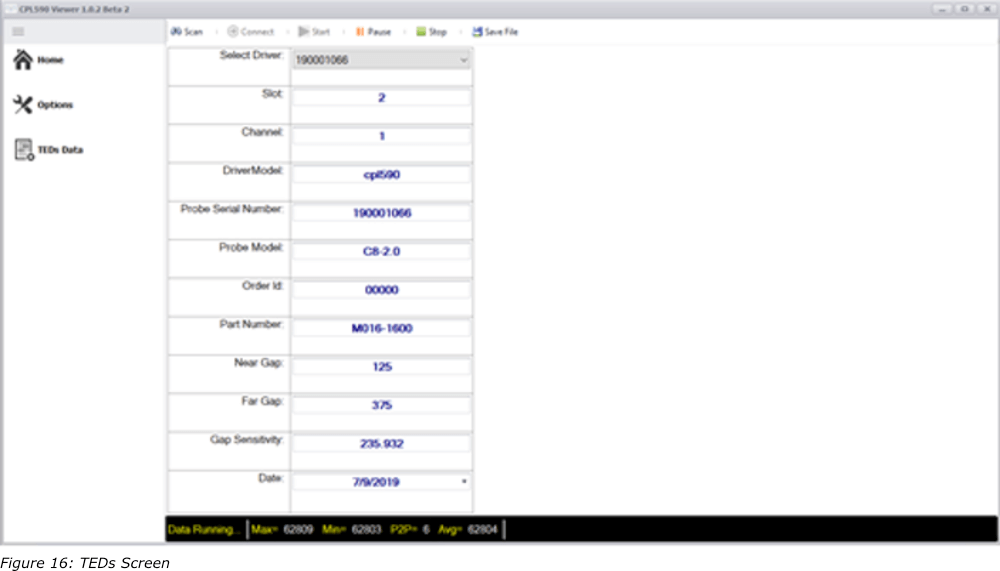
TEDs Data
When the operator selects the ‘Teds Data’ menu item, the program will retrieve the Configuration (TEDs) information from the Driver and display it in the ‘Teds Data’ dialog:
Main Data Display Screens
Scope
When the operator clicks the ‘Scope’ Tab near the top of the Main screen, the Oscilloscope View is displayed. This view will show the Plot Enables checkbox for each EN591 driver enabled to Run (in the Scan dialog). Each EN591 driver graph plot will have its own color.
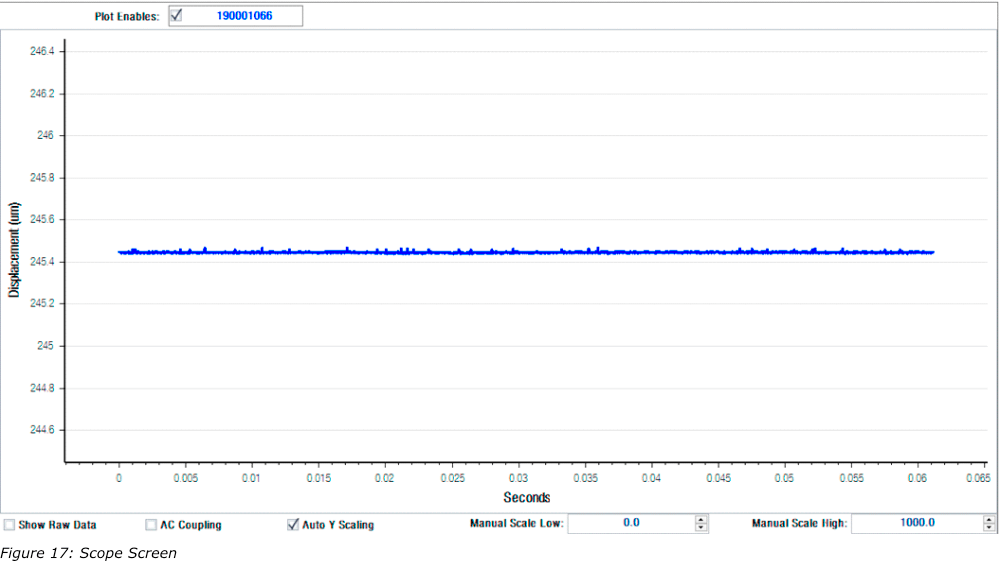
This view also has options to Display Raw Data, enable AC Coupling, perform Auto Scale of the Displacement (Y) Axis, and to set the Displacement Axis scale range (if Auto Scale is unchecked).
Meter
When the operator clicks the ‘Meter’ Tab near the top of the Main screen, the Probe position Gauge is displayed. This view will show the Plot Enables checkbox for each EN591 driver enabled to Run (in the Scan dialog). Each EN591 driver gauge needle will have its own color.
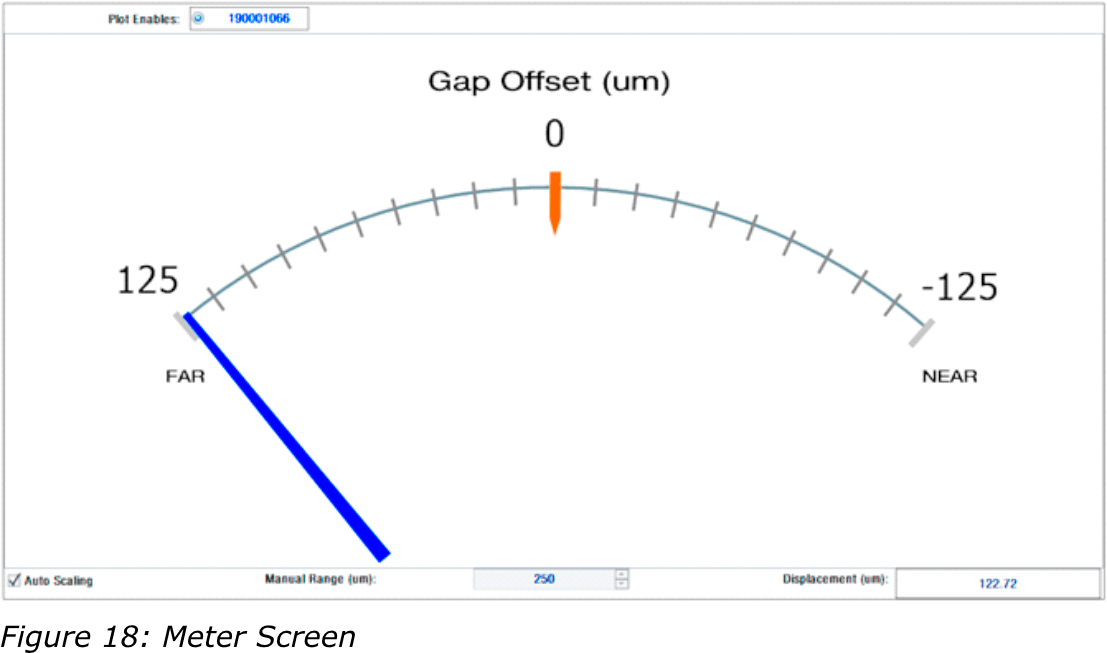
This view also has options to Perform Auto Scale and to set the Manual Axis scale range (if Auto Scale is unchecked).
APPENDIX B
SPI – General
The Serial Peripheral Interface (SPI) is a synchronous serial communication interface that is typically used in embedded systems. The EN591 device is designed to be a slave architecture support standard CPOL0 and CPHA0. The master device (Host) generates the frames for reading/writing and timing. This protocol can be the standard four-wire SPI serial bus by pulling the ASSERT line low all the time and ignoring the BCLK.
LVDS (low-voltage differential signaling), also known as TIA/EIA-644 is a technical standard that specifies electrical characteristics of a differential serial communication protocol for high-speed digital interface that is low power consumption and high noise immunity for high data rates.
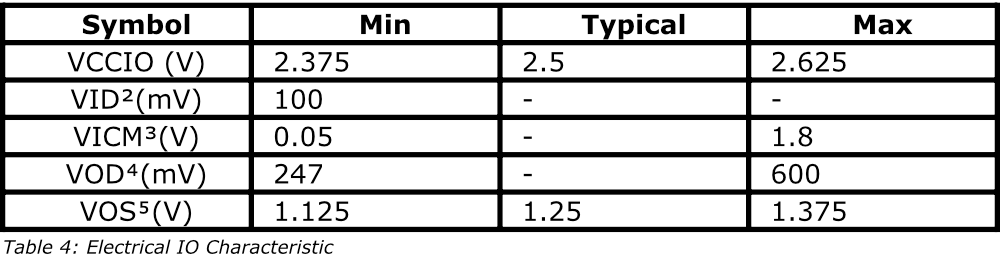
Electric Digital IO Characteristic
Each signal is transmitted by a differential data line pair. The electrical level is LVDS. On Receiver side each line must be terminated with 100 Ohms.
ESD Rating:
- IEC 61000-4-2 (ESD) 15kV (air) 8kV (contact)
- IEC 61000-4-4 (EFT) 40 A (5/50 ns)
- IEC 61000-4-5 (lighting) 2 A (8/20 µs)
- 2Input differential Voltage Swing: The difference in voltage between the positive and complementary conductors of a differential transmission at the receiver.
- 3Input common mode voltage: The common mode of the differential signal at the receiver.
- 4Output differential voltage swing: The difference in voltage between the positive and complementary conductors of a differential transmission line at the transmitter. VOD = VOH – VOL
- 5Output offset voltage: VOS = (VOH + VOL) / 2
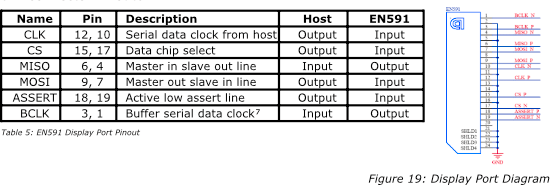
SPI Connector Pinout6
SPI Interface Protocol
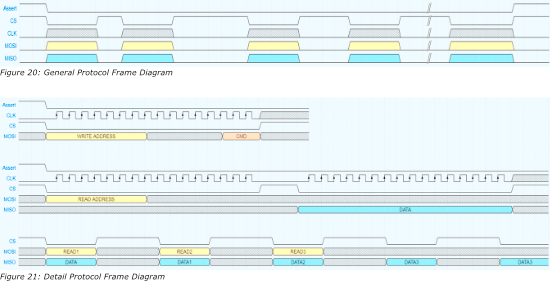
The following diagram shows the transfer of one single 16-bit data word. All data words of a packet are transferred serially with the highest bit first. The data bits of the MISO and MOSI line shift in/out at the rising edge of CLK. The CLK line is active only while data bits are transferred.
- 8Pinouts are differential pair and consist of inverted and non-inverted. Column PIN is organized as non-inverted pin followed by inverted line.
- 7Buffer serial clock are recommended, if 6 meters or longer cable is used. EN591 will buffer the incoming clock from host and output from the slave back to host. Thus, host can clock in MISO with this pin to eliminate timing error caused by long cable propagation delay.
Timing Diagrams
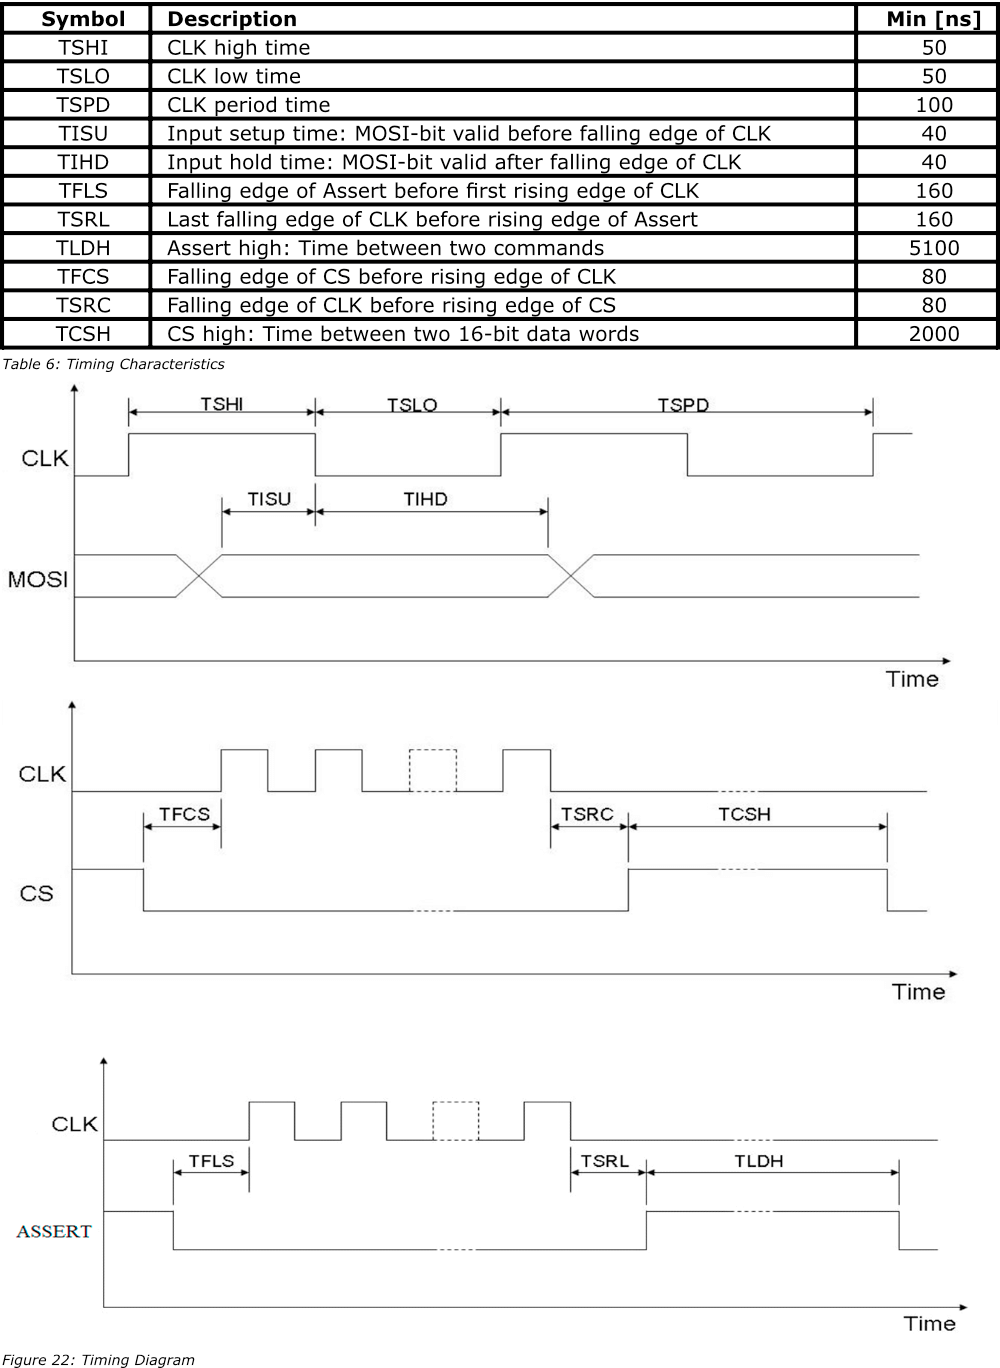
Write Command 8 9
Write command is the action that can change/set state to EN591. After a new set of write commands has been sent, it will be latched in on the raising edge of the CS when assert line stays low.

Display Port Cable Reference Wiring